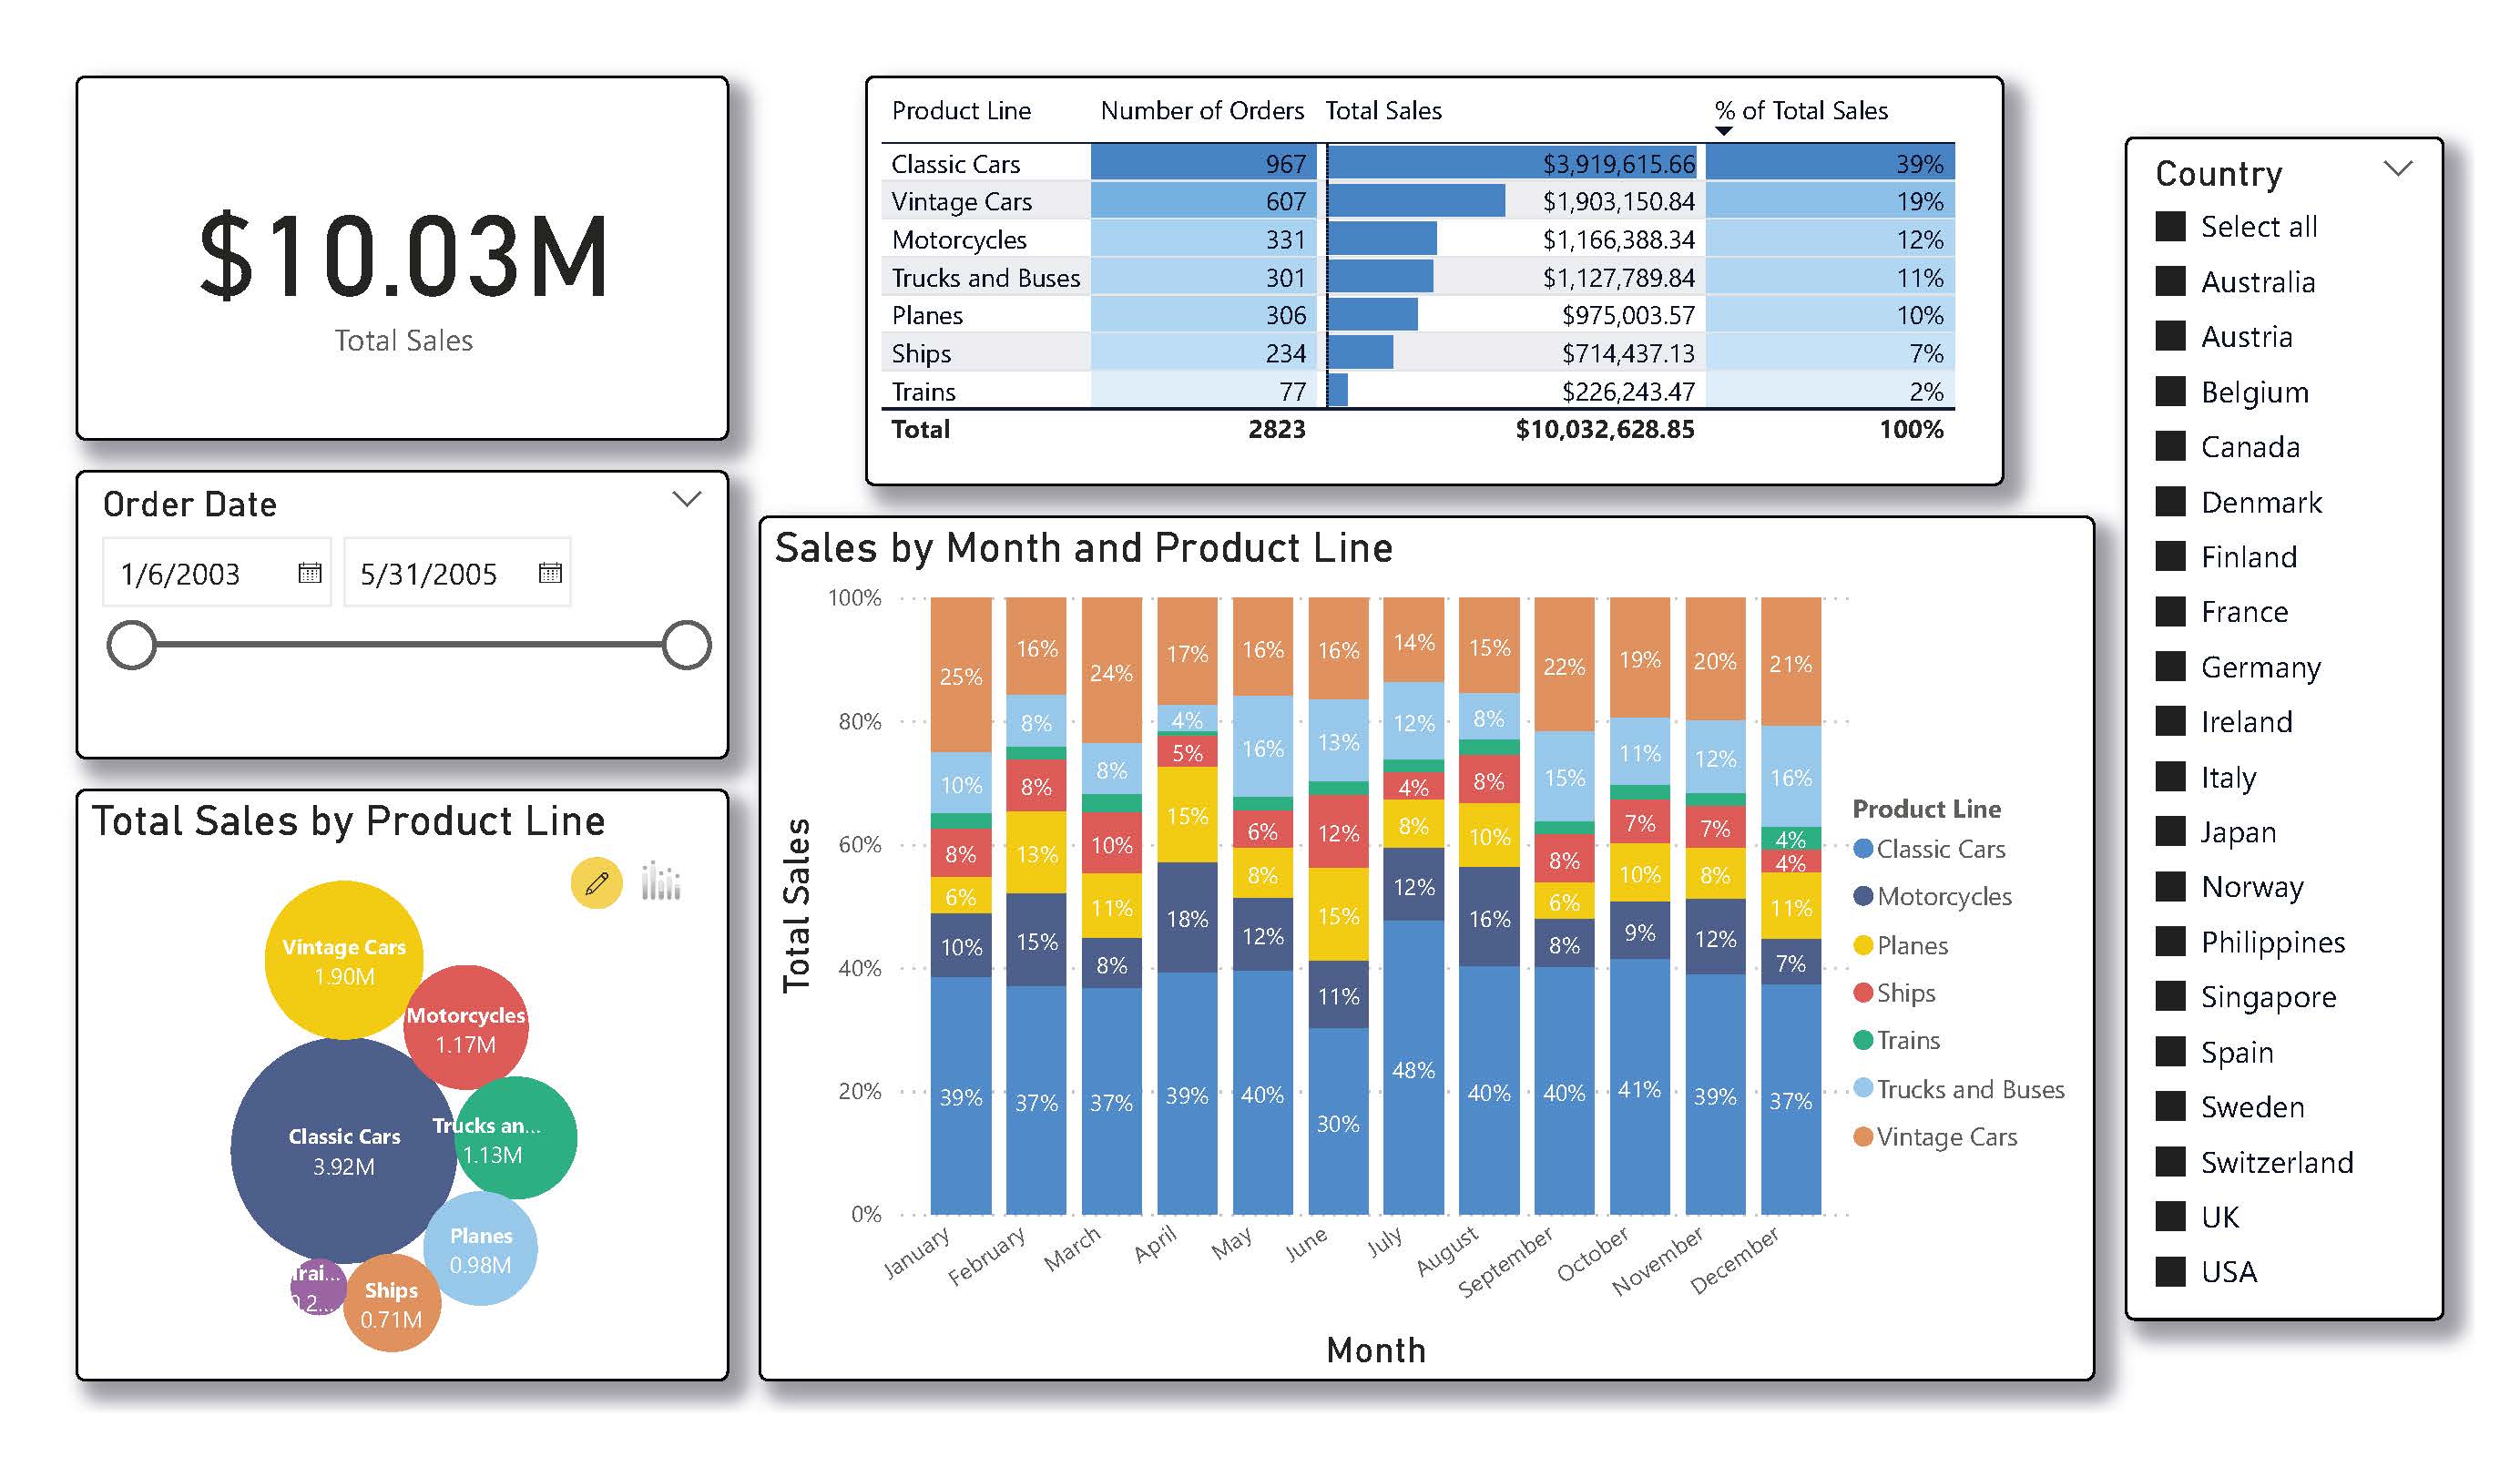
Toy Company Sales
View sales data from a wholesale toy distributor to uncover weekly, monthly, and seasonal trends
View Dashboard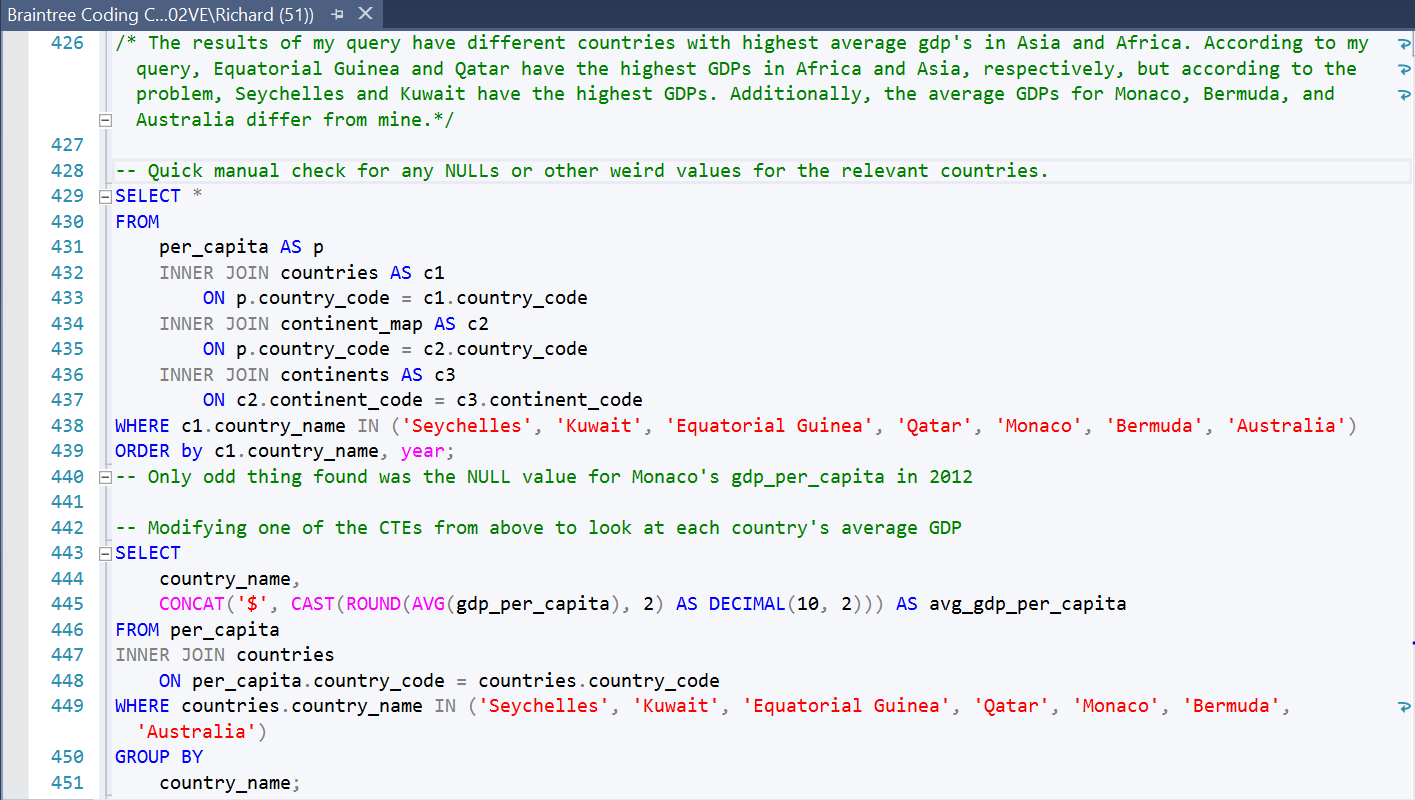
These queries were used to answer a take-home SQL interview posted on GitHub. The questions didn't necessarily make sense, but it was a good chance to practice some SQL!
View Project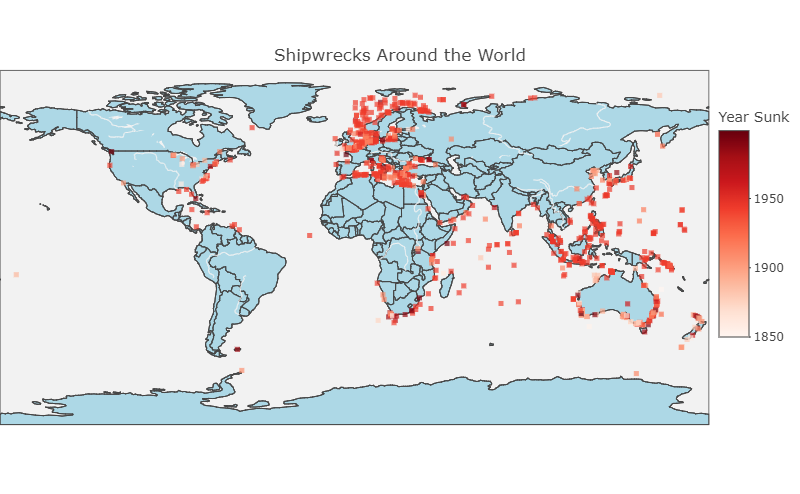
A project analyzing when and where shipwrecks have occured throughout history. Can you guess where the peaks are? Take a look at this project in R to find out.
View Project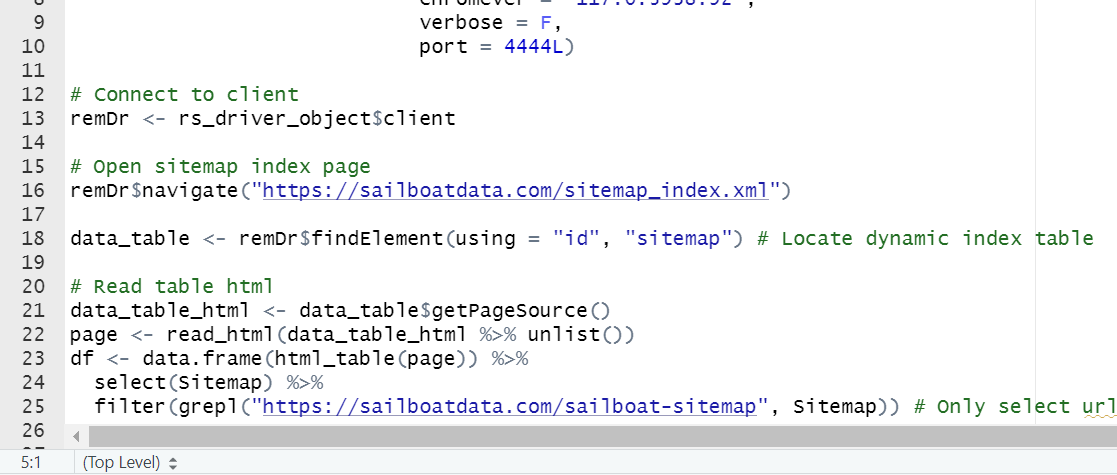
Web scraper for extracting data on 8,947 sailboats hosted inside dynamic html tables at sailboatdata.com. Created using RSelenium!
View ProjectHere you can see some of the Power BI dashboards I have created. If interested, you can find the .pbix files in my public GitHub portfolio. The link is provided in the "Get In Touch" section at the bottom of this page.
View sales data from a wholesale toy distributor to uncover weekly, monthly, and seasonal trends
View Dashboard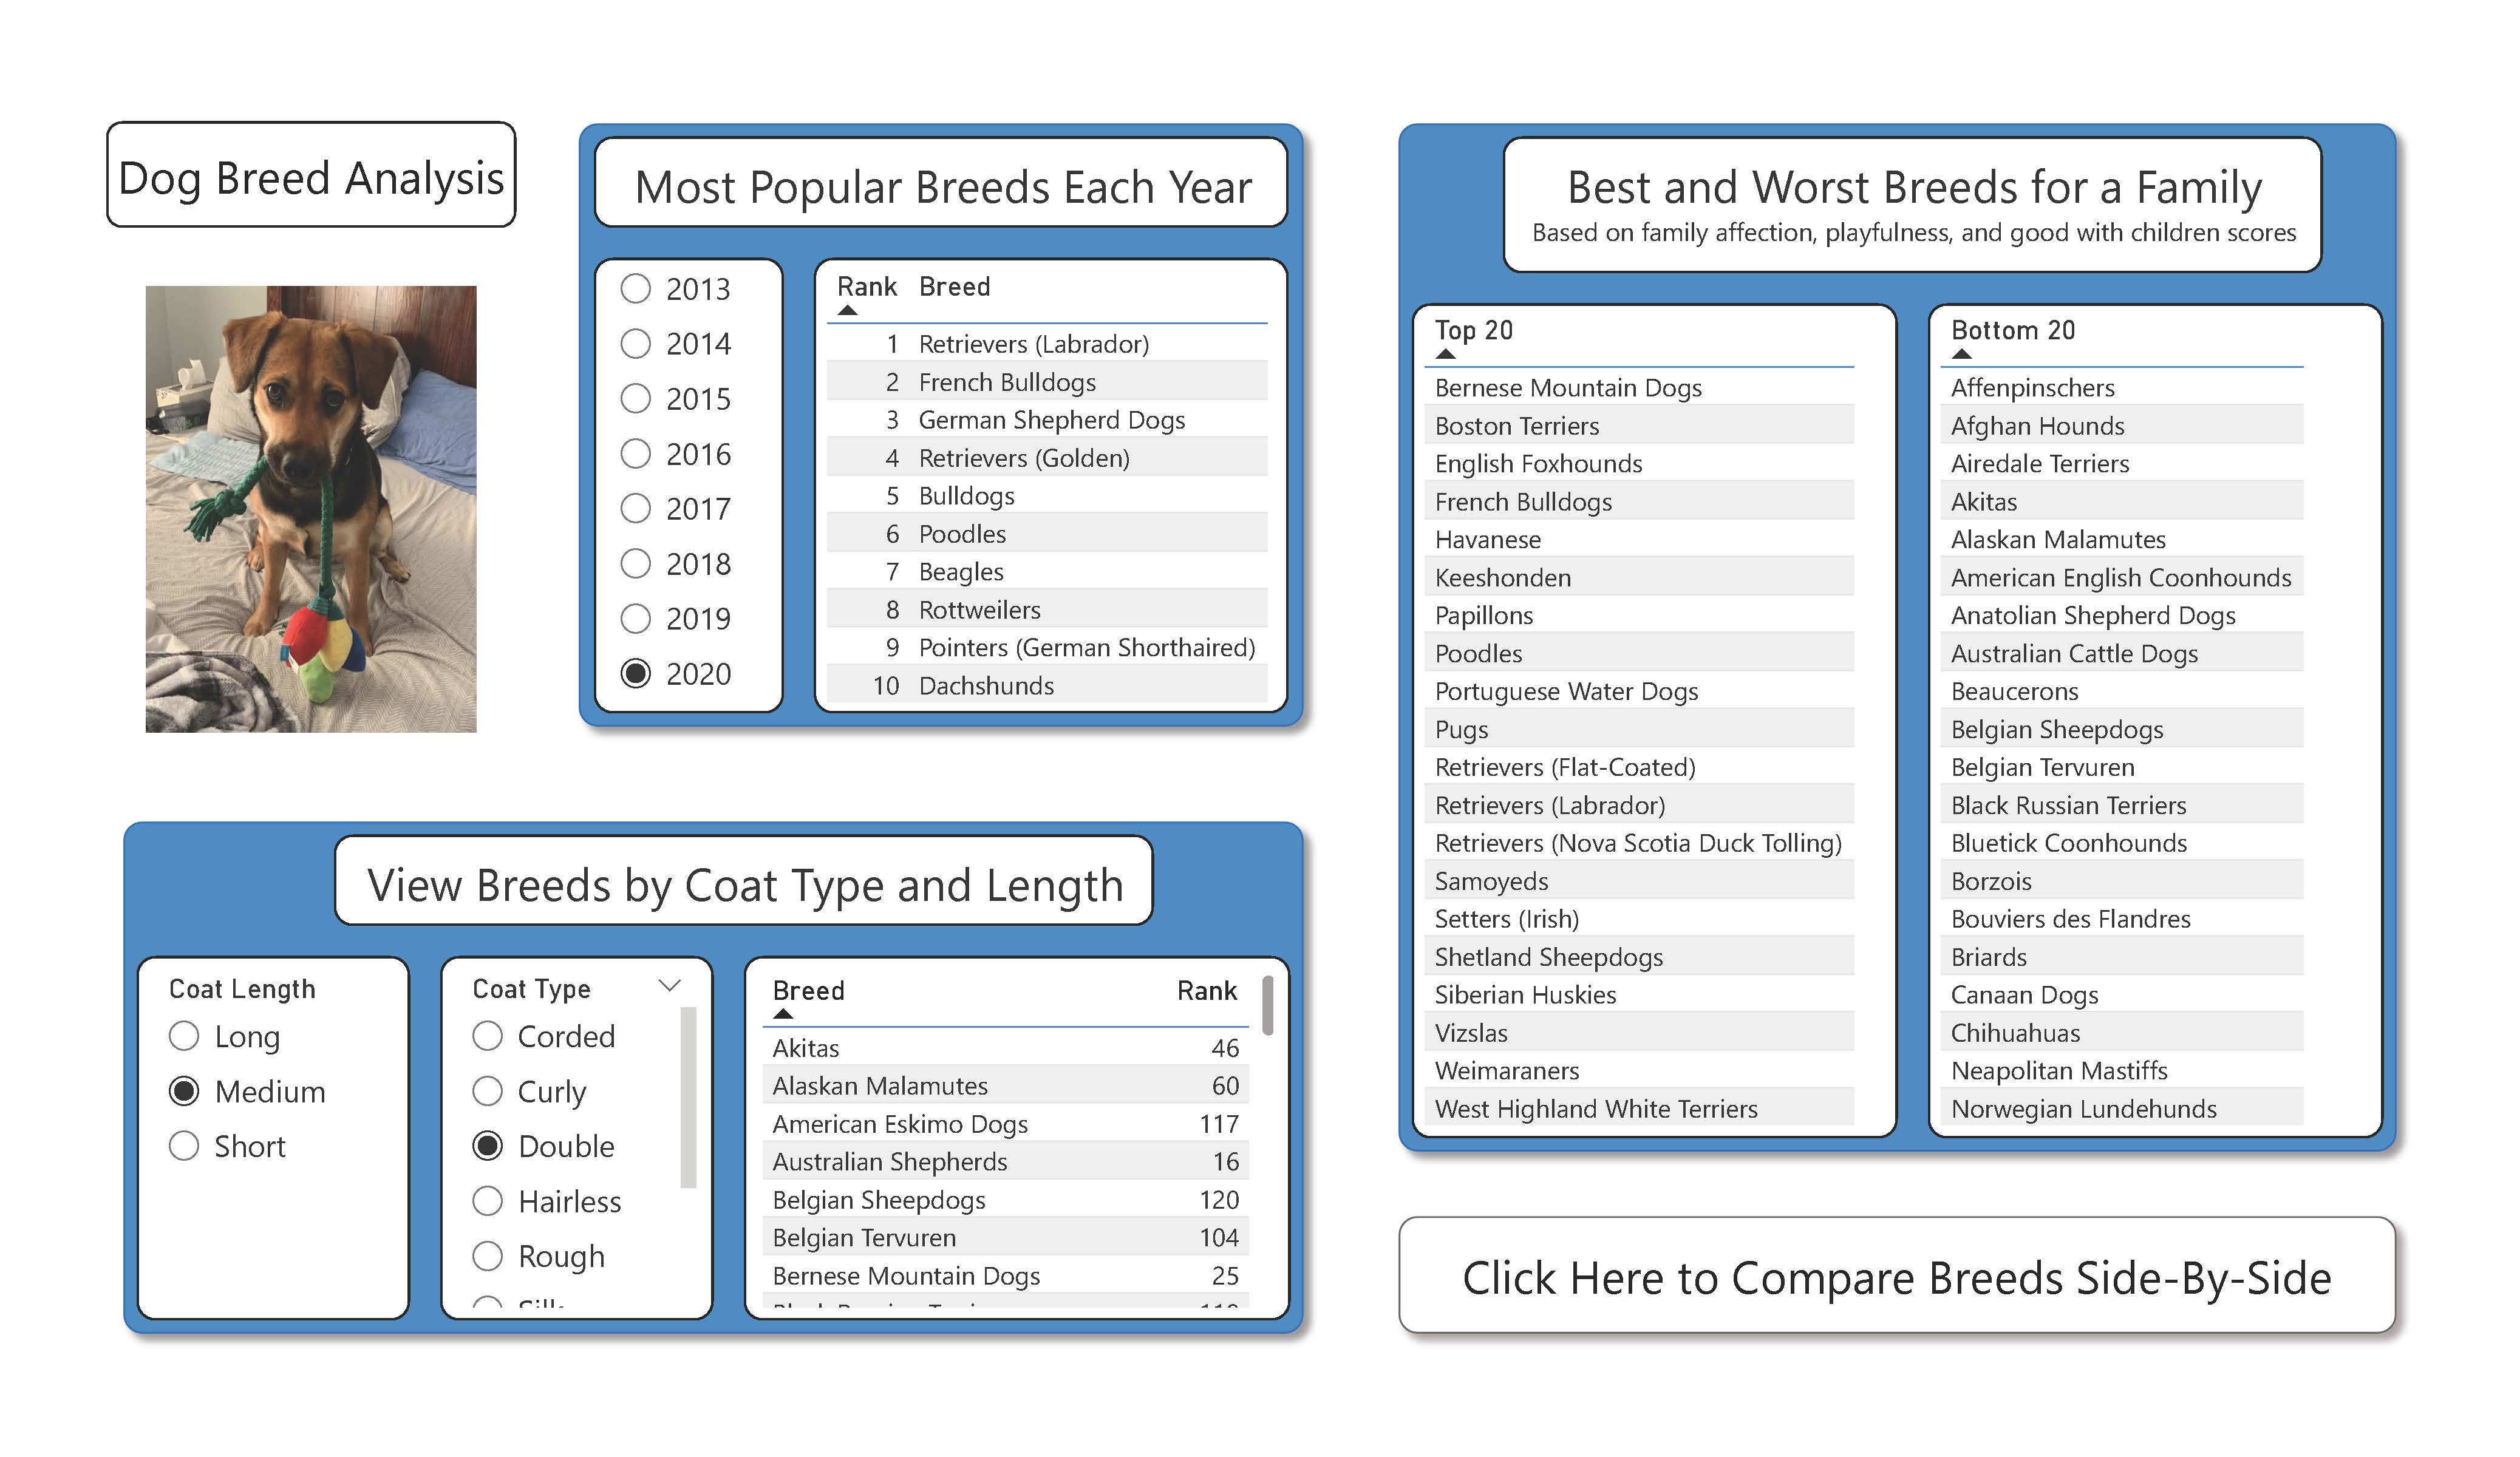
Use this dashboard to learn more about different dog breeds and find out which one is right for you
View Dashboard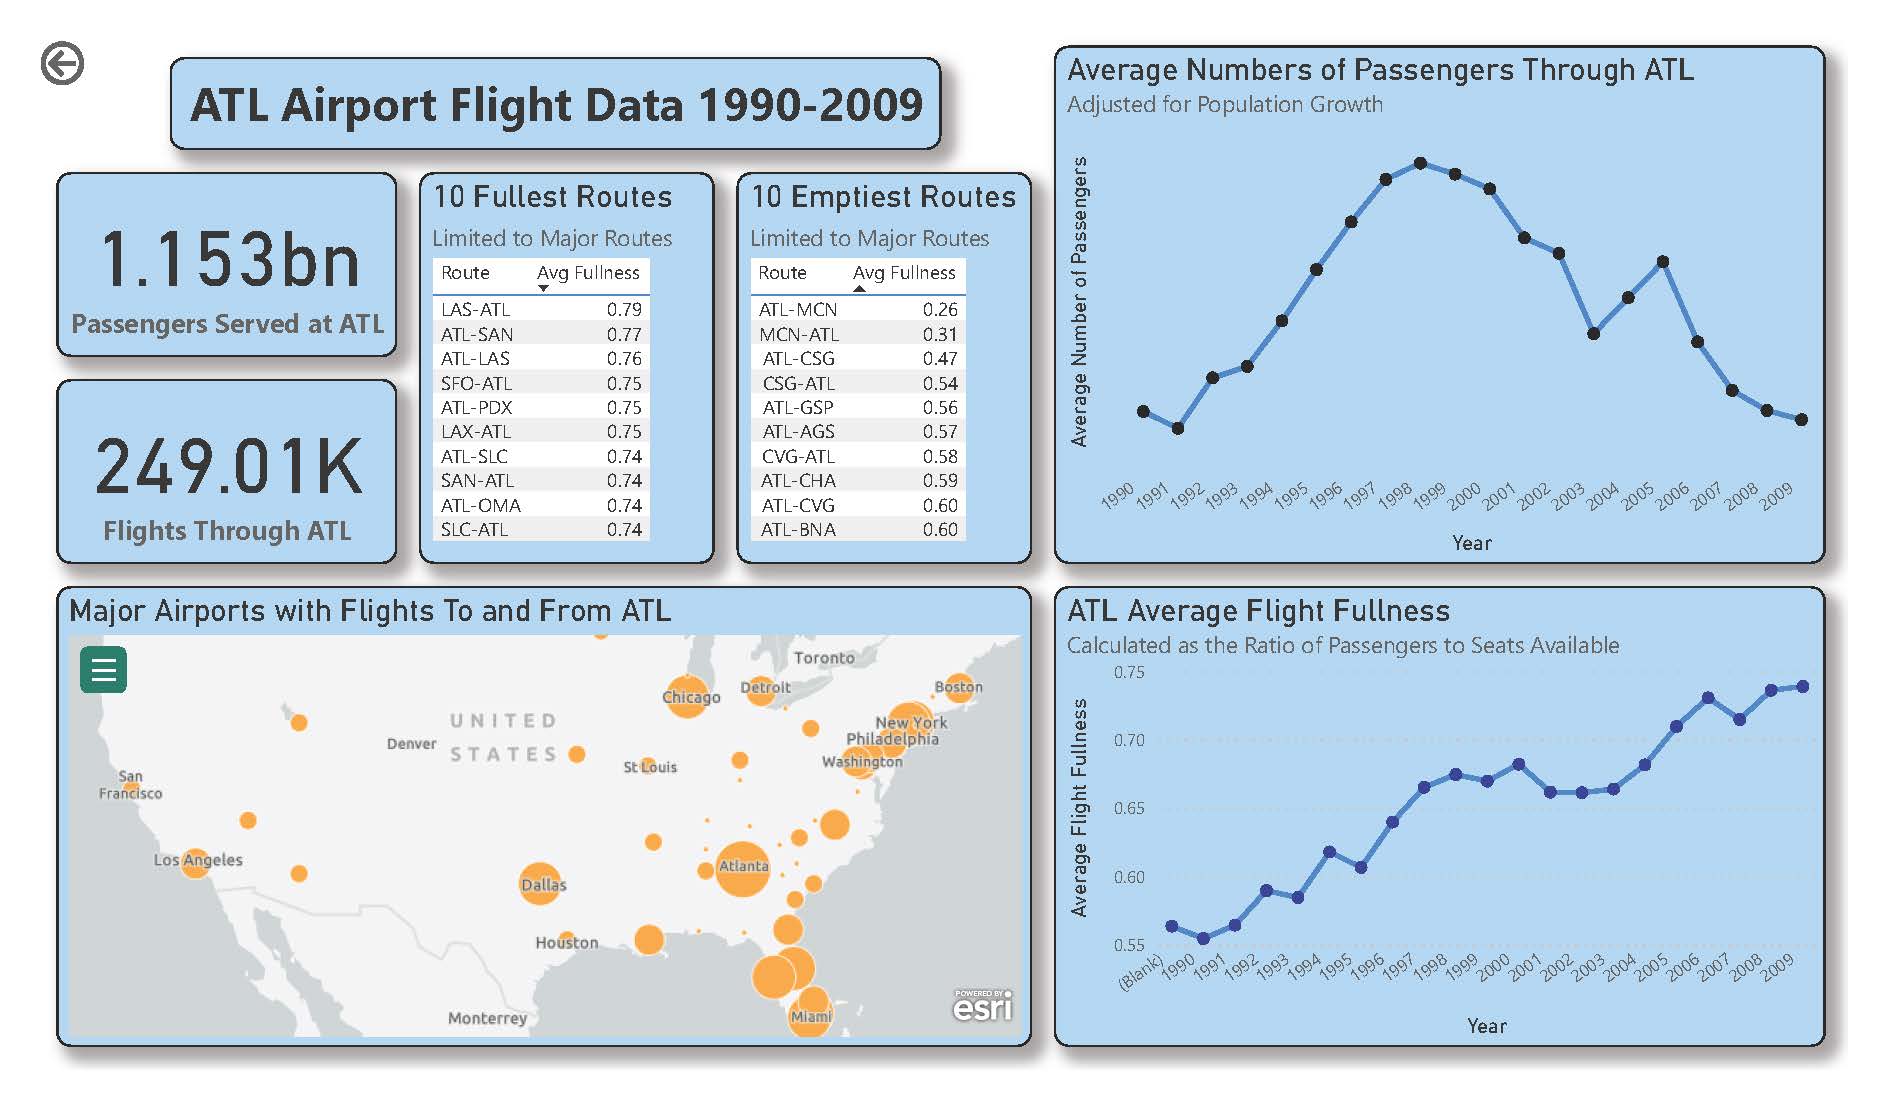
Get a better understanding of historical changes in traffic through Atlanta airport adjusted for change in population as measured by US census data
View Dashboard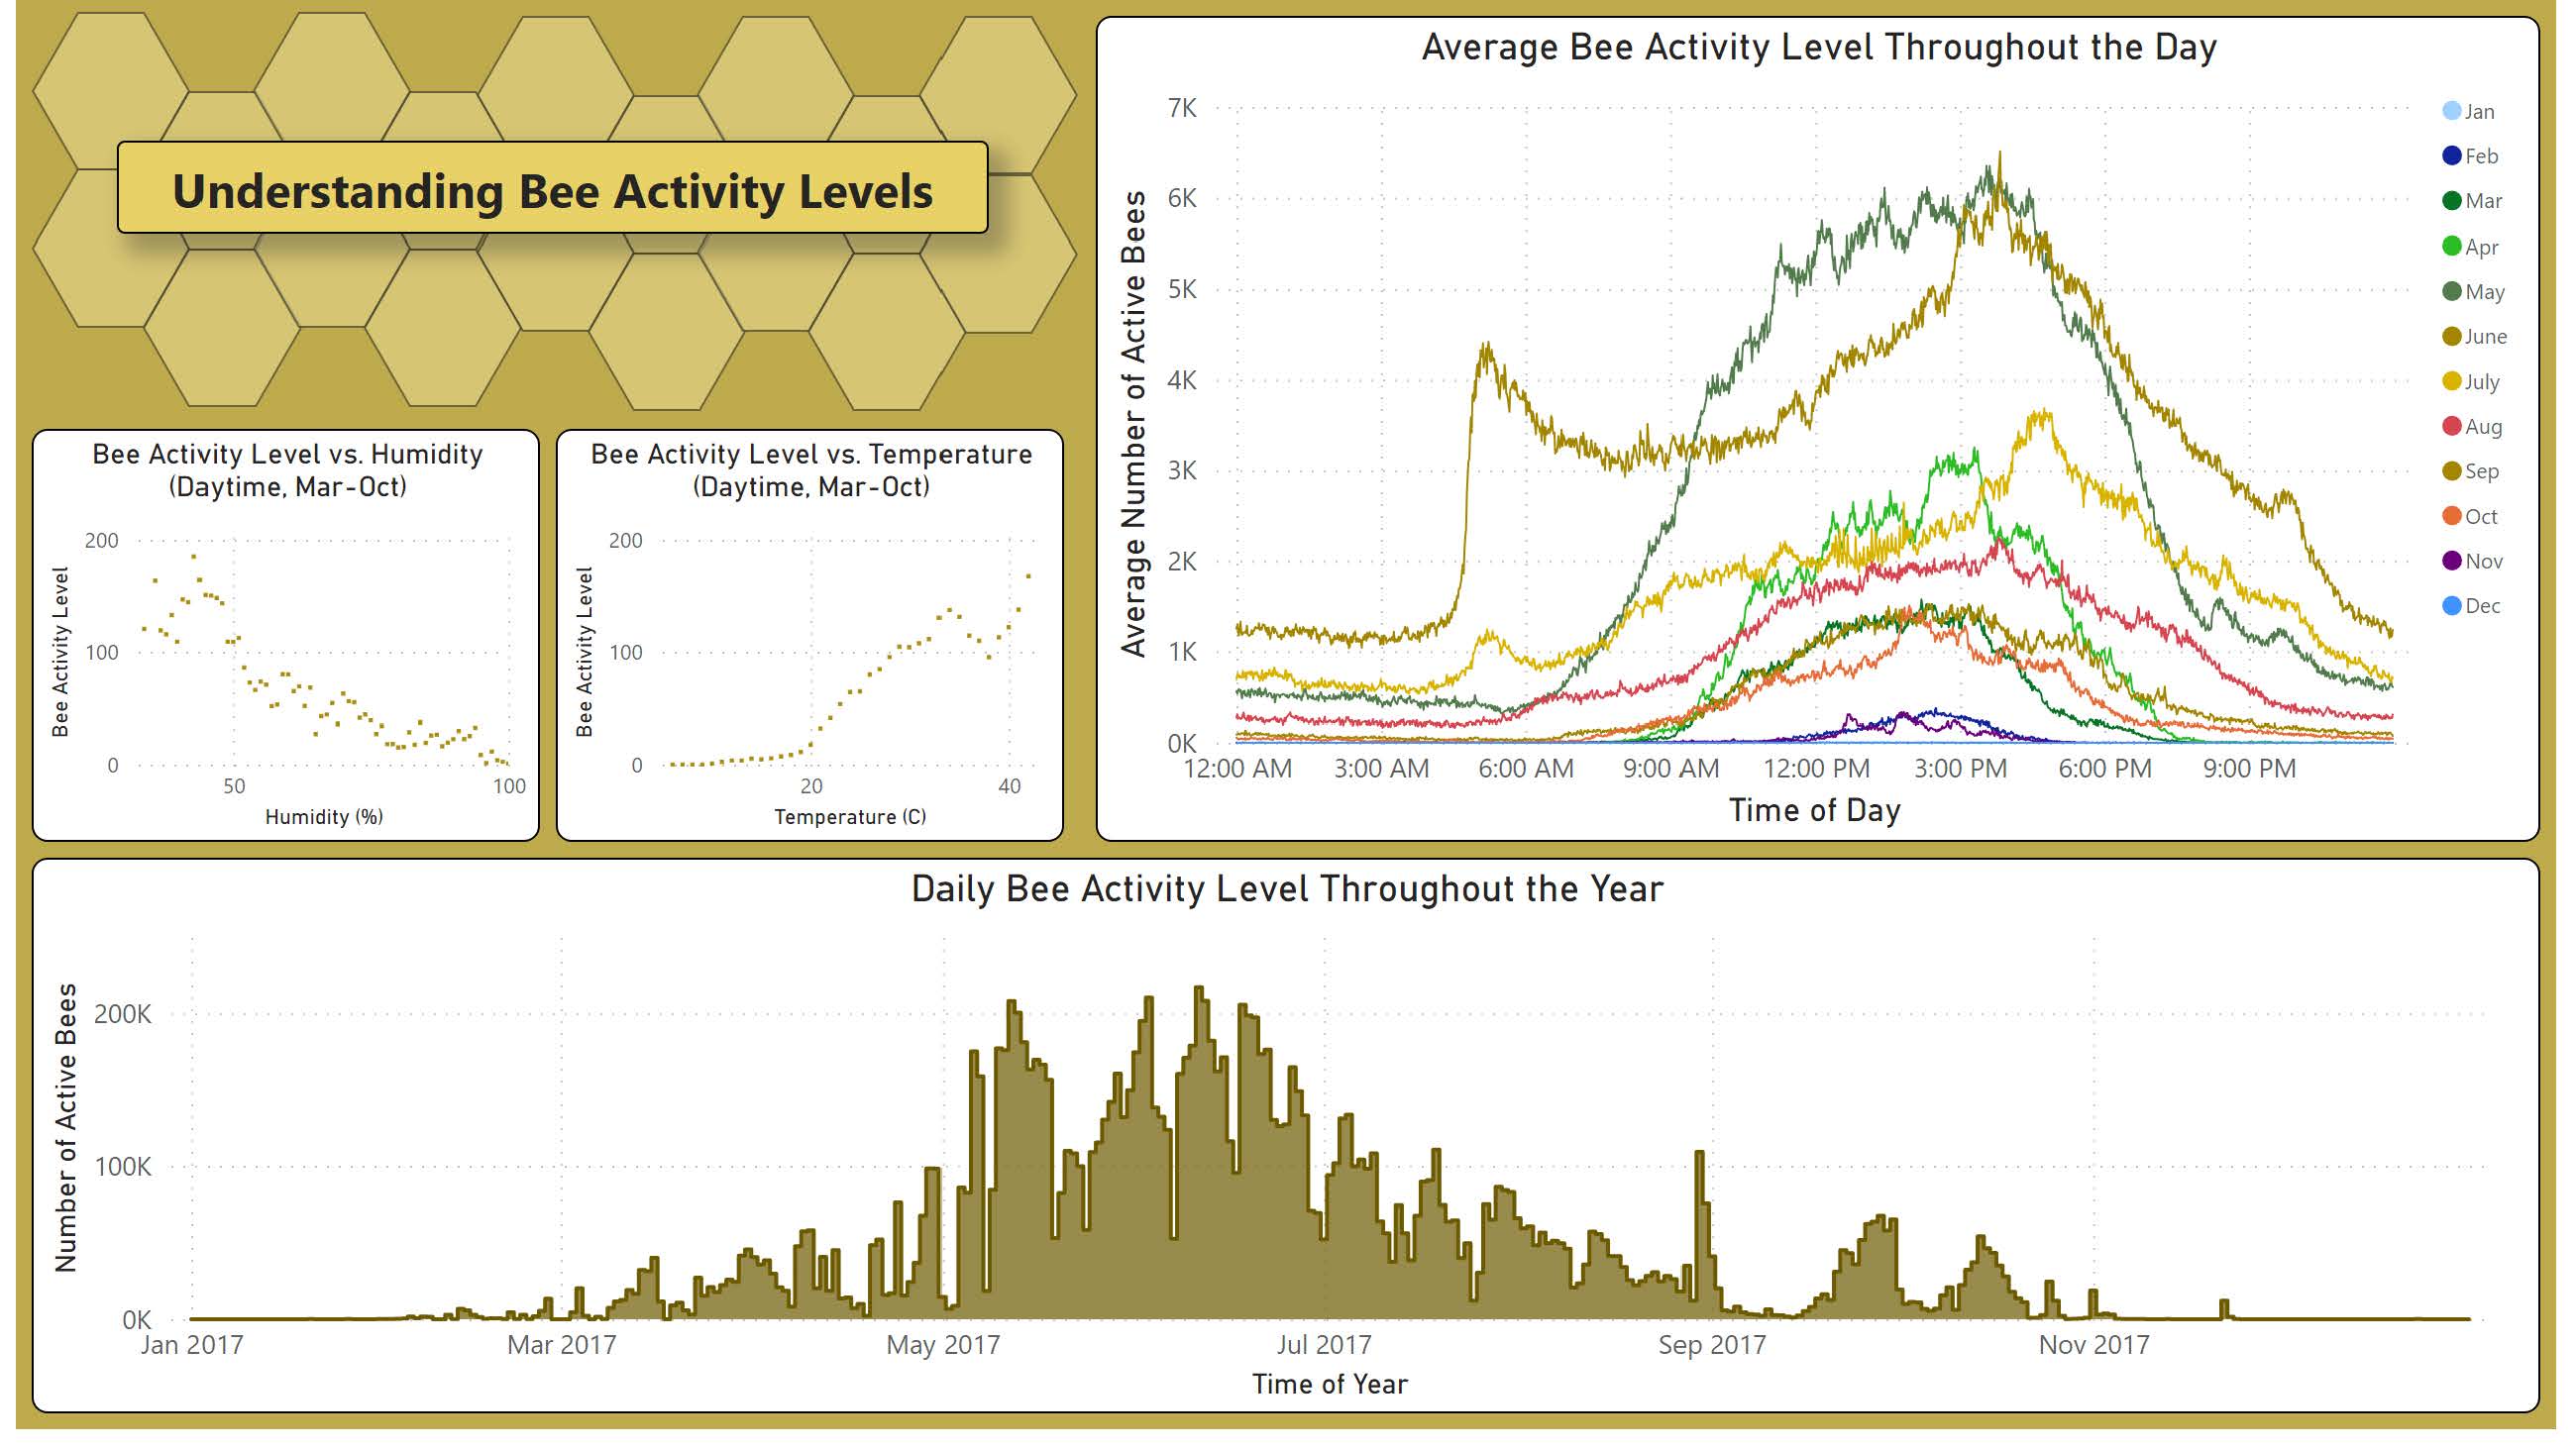
See how bee activity levels change throughout the day and throughout the year and the effects temperature and humidity have on hive activity
View Dashboard